Conversion Temperature Chart: A Guide to Easy Temperature Conversions
Understanding Temperature Scales
When it comes to temperature, different countries and industries use different scales. The most common scales are Celsius, Fahrenheit, and Kelvin. While Celsius is widely used in most parts of the world, Fahrenheit is commonly used in the United States. Kelvin, on the other hand, is used in scientific and industrial applications. Converting between these scales can be confusing, especially for those who are not familiar with the conversion formulas.
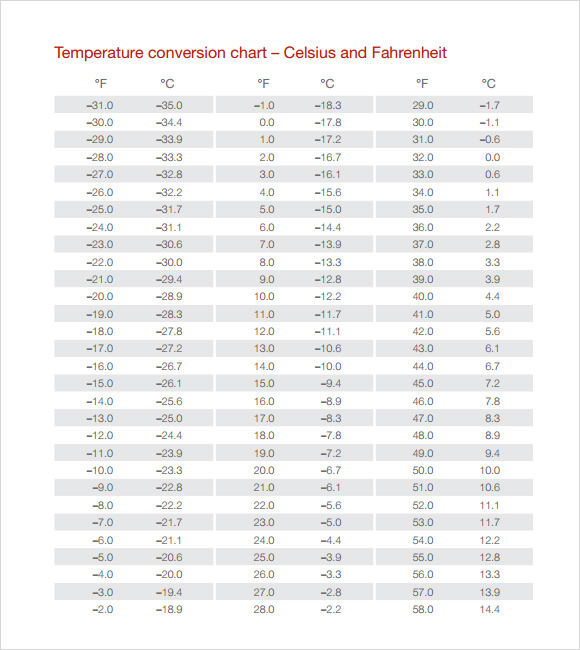
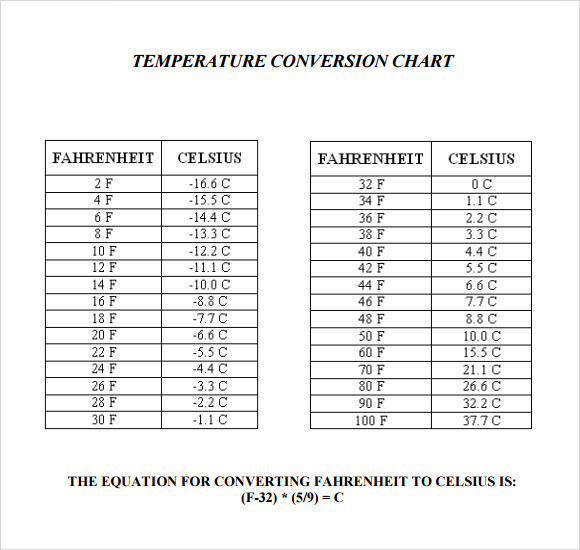
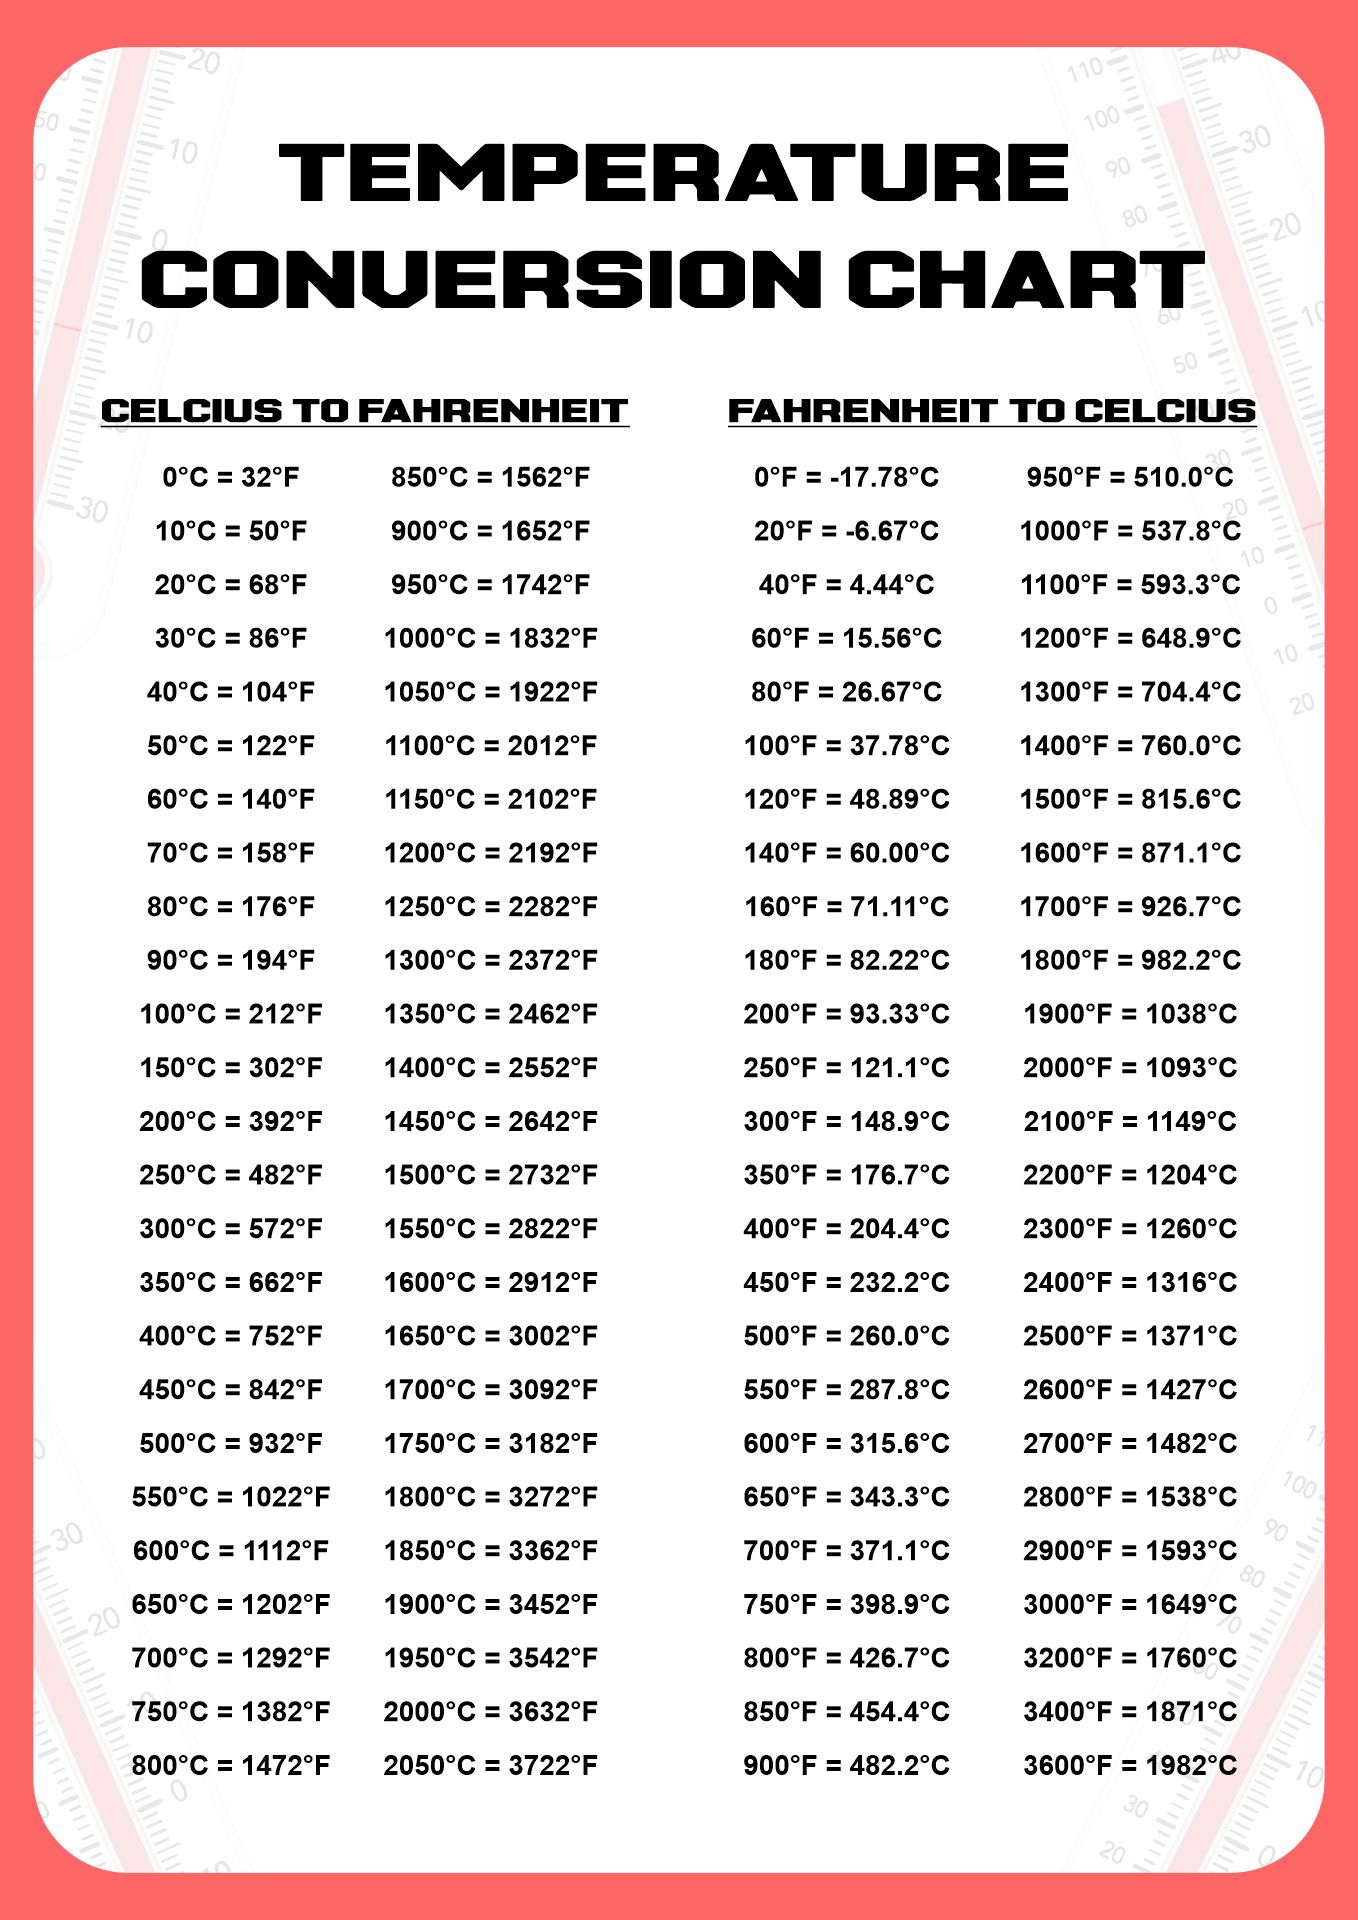
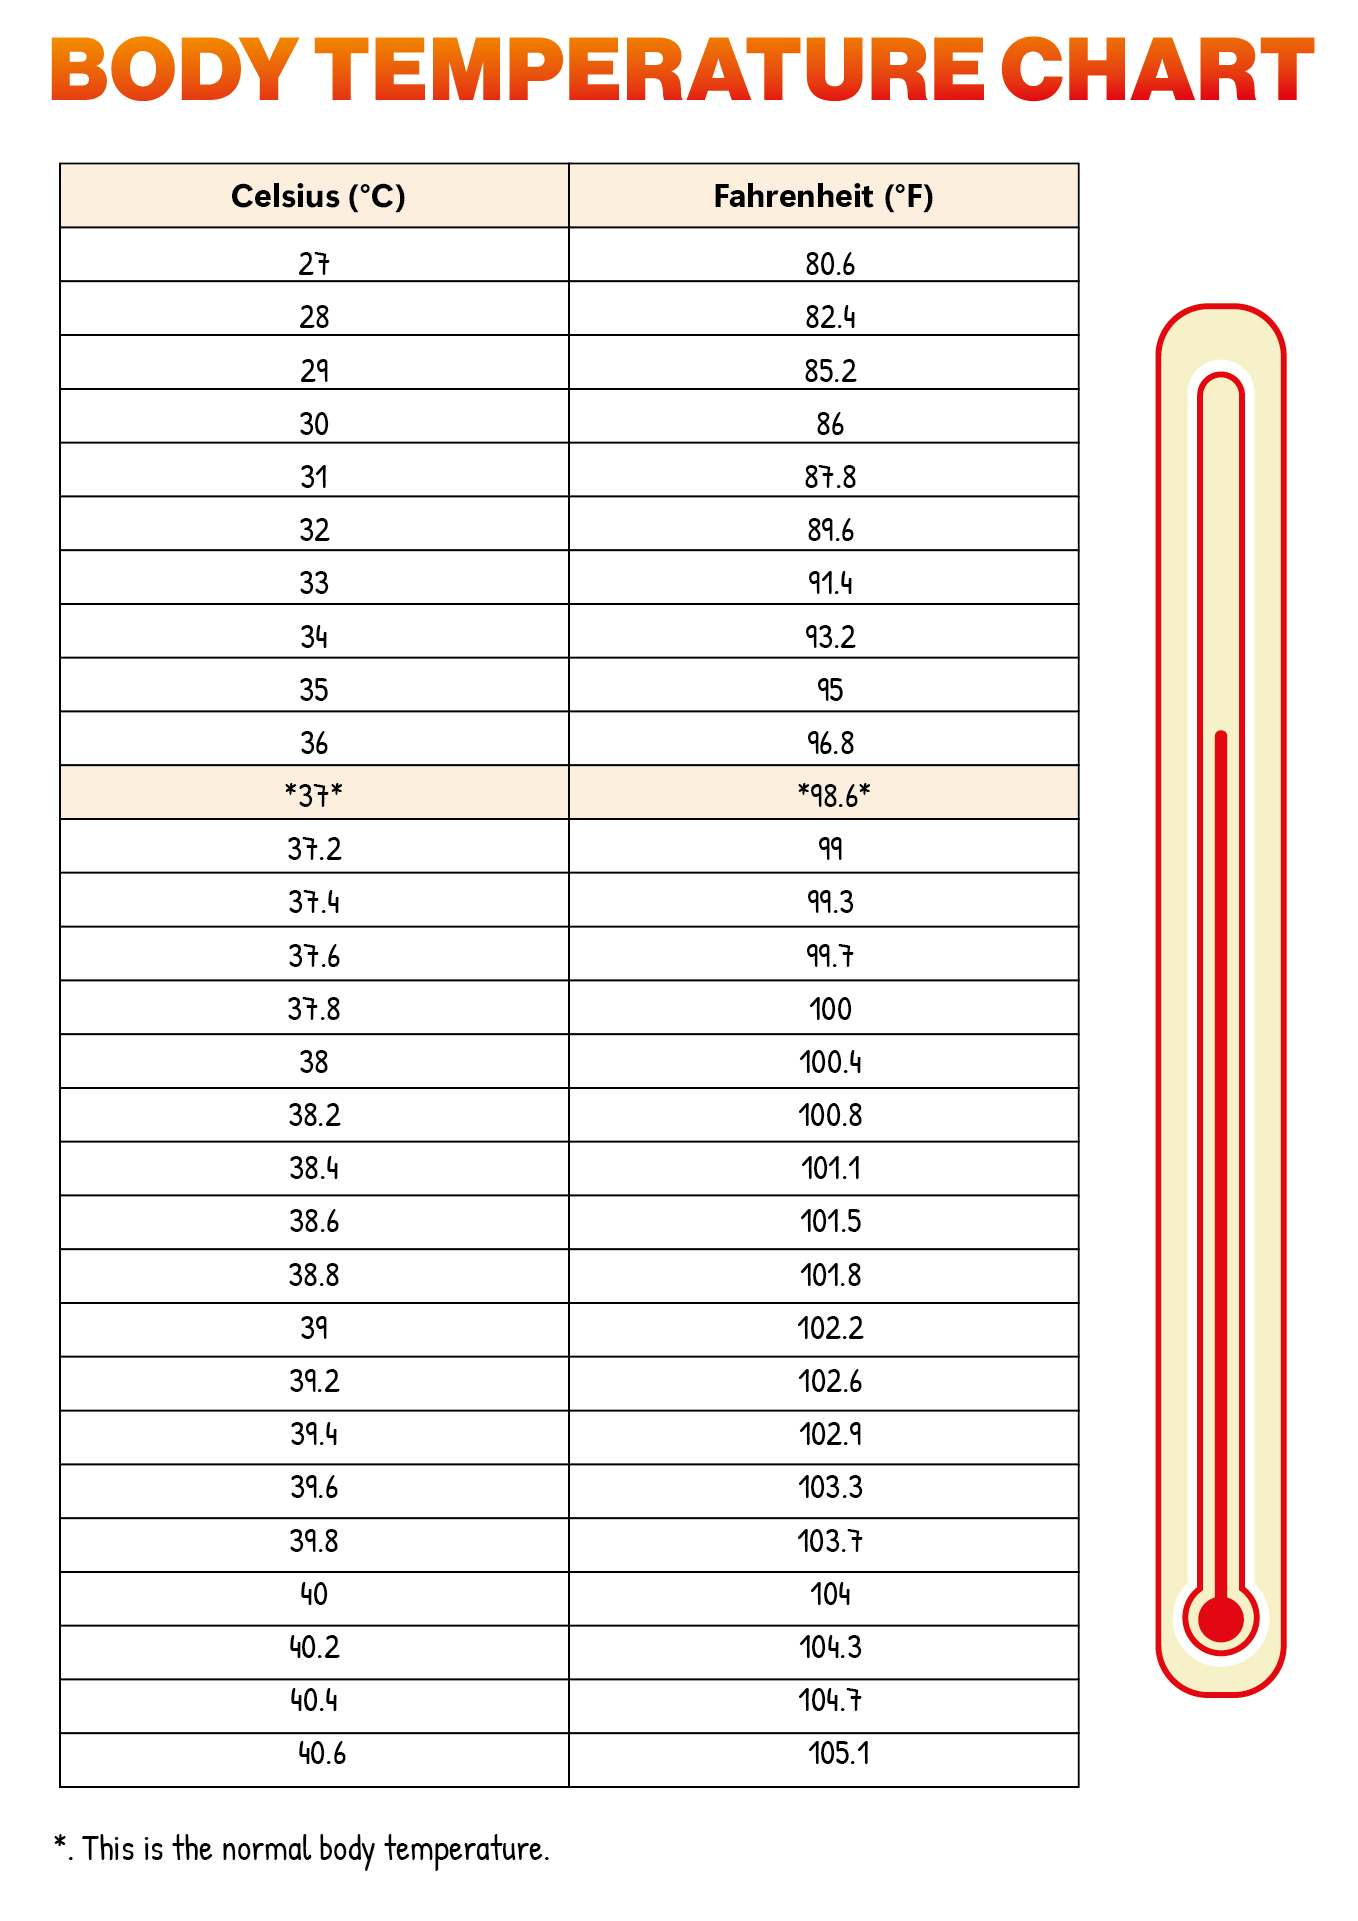
A conversion temperature chart is a useful tool that can help you convert temperatures easily. It's a table or graph that shows the equivalent temperatures in different scales. With a conversion temperature chart, you can quickly convert a temperature from one scale to another without having to use a formula or calculator. This can be especially useful in situations where you need to make quick conversions, such as in cooking, science experiments, or industrial processes.
Using a Conversion Temperature Chart
The Celsius scale is based on the freezing and boiling points of water, where 0 degrees Celsius is the freezing point and 100 degrees Celsius is the boiling point. The Fahrenheit scale, on the other hand, is based on a different set of reference points. The Kelvin scale is an absolute temperature scale, where 0 Kelvin is absolute zero, the theoretical temperature at which all molecular motion ceases. Understanding the differences between these scales is important for accurate temperature conversions.
Using a conversion temperature chart is straightforward. Simply find the temperature you want to convert on the chart, and then look at the equivalent temperature in the other scale. For example, if you want to convert 30 degrees Celsius to Fahrenheit, you can look at the chart and see that it's equivalent to 86 degrees Fahrenheit. You can also use online temperature conversion tools or calculators if you don't have a physical chart. With a conversion temperature chart, you can make quick and accurate temperature conversions, making it an essential tool for anyone who works with temperatures.