
Conversion Chart For Temperature Printable: A Handy Guide

Understanding Temperature Conversion
Are you tired of struggling to convert between different temperature units? Whether you're a student, a scientist, or just a curious individual, a conversion chart for temperature can be a lifesaver. In this article, we'll explore the importance of temperature conversion and provide you with a handy printable chart to make your life easier.
Temperature conversion is a crucial skill in various fields, including science, engineering, and cooking. With a printable temperature conversion chart, you can quickly and easily switch between Celsius, Fahrenheit, and Kelvin. This chart is especially useful for students who need to convert between units for their homework or exams.
How to Use a Printable Temperature Conversion Chart
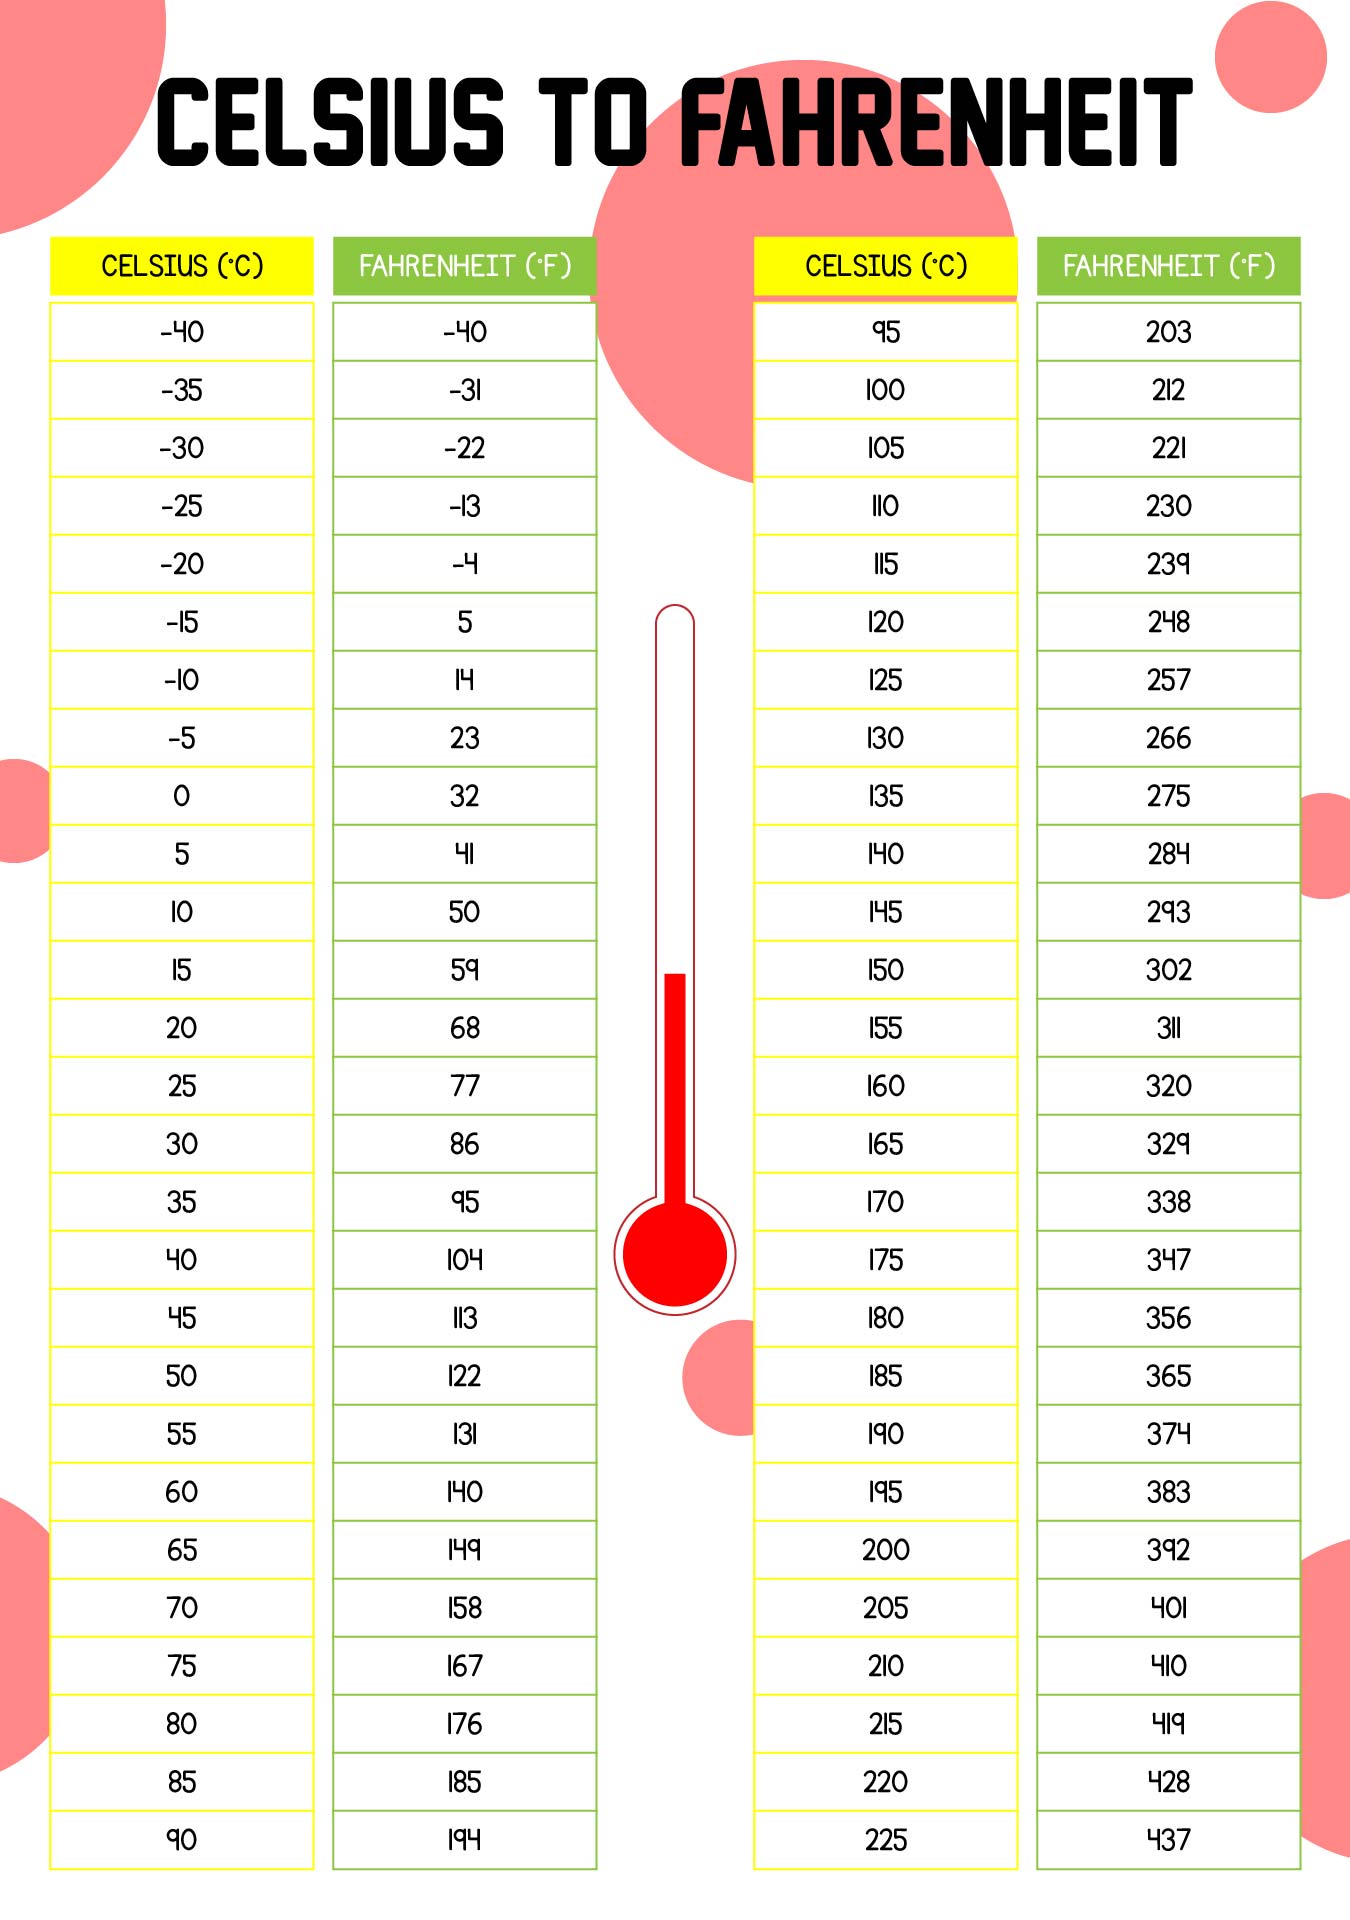
To use a temperature conversion chart, you need to understand the basic formulas for converting between units. For example, to convert Celsius to Fahrenheit, you can use the formula: (°C × 9/5) + 32 = °F. Similarly, to convert Fahrenheit to Celsius, you can use the formula: (°F - 32) × 5/9 = °C. With a printable chart, you can avoid the hassle of memorizing these formulas and simply look up the conversions as needed.
Using a printable temperature conversion chart is straightforward. Simply download and print the chart, and then use it to look up the conversions you need. You can also laminate the chart to make it more durable and long-lasting. With a printable temperature conversion chart, you'll never have to worry about getting stuck with a tricky conversion problem again. Download your free template today and start converting with ease!